Description
I need someone help me with Interpreting FTIR and MS Spectra. If you need to access beyondlabz website for doing the assignment please let me know so I can give you my information.
Enable text based alternatives for graph display and drawing entry
Click here to erase all data entry on this page
1-5: Interpreting a Mass Spectrum
Mass spectrometry is an essential characterization technique used in organic chemistry. In a common electron ionization (EI) mass spectrometry analysis, molecules in a sample are ionized and fragmented in a stream of electrons. The resulting ions are accelerated towards a detector by an electric field. The detector creates a data output known as a mass spectrum.
All mass spectra have the x-axis as m/z. This is called the mass-to-charge ratio. It is a direct ratio between the measured mass of the ion and its charge. The principle of the mass-to-charge-ratio is best illustrated by an example. If a certain ion that hits the detector has a mass of 44 g/mol (propane, C3H8) and a charge of +1, then the m/z is 44:1 = 44. If the same ion had a charge of +2, then the m/z is 44:2 = 22. Most peaks in a mass spectrum will be for ions with charges of +1, so the m/z will be the same value as the mass of the ion. The y-axis of mass spectra is intensity. The intensity of a peak is proportional to the number of ions with that specific m/z.
In a mass spectrum, the peak corresponding to the full, unfragmented molecule of interest is referred to as the molecular ion peak. The molecular ion peak is often labelled on the spectrum with M+·. The molecular ion peak is the tallest peak in the group at highest m/z. The small peak to the right of the molecular ion peak occurs in many organic mass spectra. This peak is the 13C satellite peak. This peak represents the small percentage of the molecule that have one 13C atom exchanged for a 12C atom. This occurrence leads to a mass increase of one, so the 13C satellite peaks are always one m/z larger than the molecular ion peak. The most intense (tallest) peak in the spectrum is referred to as the base peak. All peaks below the molecular ion peak represent fragments of the full molecule and are therefore referred to as fragment peaks. These fragments are often identical between similar molecules.
In this assignment, you will be guided through the steps of mass spec analysis. This assignment will also serve as a tutorial to teach you how to utilize the various parts of the organic simulation that will be used in later assignments.
- To start this activity, click this link for Interpreting a Mass Spectrum. The lab will load in a new tab. Click back to this tab to read further instructions and complete the questions below. You will see a lab bench containing reagents on the back of the bench, aqueous reagents on the right, an equipment rack containing necessary laboratory equipment, a red disposal bucket for cleaning up the lab, and the organic stockroom in the back. Other pieces of laboratory equipment will be used in other assignments.
- The spectra menu is open on the right in the tray. Click the MS button to view mass spectra and open the spectrum for 2-propanone (commonly known as acetone).
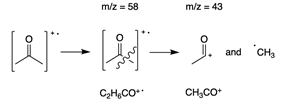
- You can see the m/z and intensity of any peak by hovering over it. The molecular weight of acetone is 58 g/mol. Therefore, the molecular ion peak is the peak at m/z = 58 as shown in the figure above. The base peak for this spectrum is at m/z = 43. This peak represents a fragment of the acetone molecule. Tables of common mass spec fragments are readily available online and can help you to determine the identity of fragment peaks. The peak at m/z = 43 corresponds to CH3CO+. The origin of this fragment can be seen by drawing the structure of acetone, as shown below.
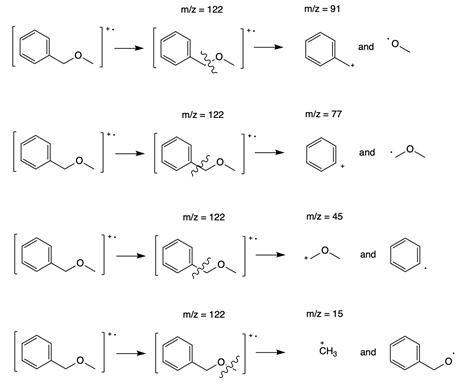
- Close the mass spectrum for acetone and return to the list of spectra. Select the spectrum for benzyl methyl ether [also called (methoxymethyl)benzene]. The molecular weight of benzyl methyl ether is 122 g/mol, and so the molecular ion peak is the one at m/z = 122. The base peak in this spectrum is at m/z = 91. There are also fragment peaks at 77, 45, and 15. These fragment peaks all provide clues about the identity of the molecule.
The fragmentation patterns are outlined below.
- Close the spectrum for benzyl methyl ether. Select the spectrum for 2-butanol.
What is the m/z of the molecular ion peak?
What is the m/z of the base peak?
What other fragment peaks can you identify?
Draw at least one fragmentation pattern.
6. Close the spectrum for 2-butanol and select the spectrum for acetic acid.
What is the m/z of the molecular ion peak?
What is the m/z of the base peak?
What other fragment peaks can you identify?
Draw at least one fragmentation pattern.
7. Close the spectrum for acetic acid and select the spectrum for 1-isopropyl-2-methyl benzene.
What is the m/z of the molecular ion peak?
What is the m/z of the base peak?
What other fragment peaks can you identify?
Draw at least two fragmentation patterns.
8. Close the spectrum for 1-isopropyl-2 methyl benzene and select the spectrum for 3-butenol.
What is the m/z of the molecular ion peak?
What is the m/z of the base peak?
What other fragment peaks can you identify?
Draw at least two fragmentation patterns.